MELTS/pMELTS Graph Display
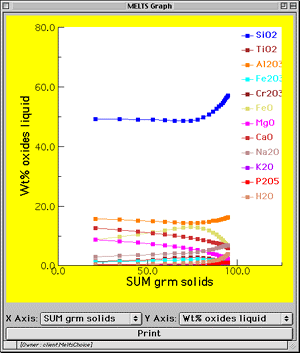
 The MELTS/pMELTS graphical display window is created when the user
presses the Display Graph
button on the main graphical user interface. The displayed results
are cumulative over the current session and cannot be cleared without reinitializing
the APPLET. The options and features of the graphical display
window are limited and will be expanded greatly in future releases
of APPLET. The user may set the content
displayed on each axis and print
the displayed graph. The user may not change the symbols or colors
of the plotted points or alter the minimum and maximum values on the axes.
There is no zoom feature. The graphical display window may be kept
open during a multistep calculation. It will be updated along with
the APPLET graphical user interface upon every return from the server.
Setting the Axis Content
The item plotted on each axis of the graphical display window is
determined through selection in the X Axis popup menu and the Y
Axis popup menu, both of which are located under the graph box
and above the Print button.
The X Axis popup menu provides four choices:

-
SUM grm solids causes the total grams of solids in the system to
be plotted on the X-axis. Note that if the user has turned on Fractionation
of solids, then the mass of solids produced at each step in a multistep
calculation sequence is removed from the system at the subsequent step.
So, the value for SUM grm solids will not include the solids removed
by fractionation, only the current solid mass in the assemblage.
-
SUM grm liquid causes the total grams of liquid in the system to
be plotted on the X-axis.
-
Temperature causes the temperature (in C) of the system to be plotted
on the X-axis.
-
Pressure causes the pressure (in kilobars) of the system to be plotted
on the X-axis.
The Y Axis popup menu provides four choices:

-
Wt% oxides liquid causes the composition of the liquid to be plotted
on the Y-axis in terms of wt% oxides.
-
grms of phases causes the equilibrium assemblage to be plotted on
the Y-axis in terms of grams of each phase present.
-
System mode causes the equilibrium assemblage to be plotted on the
Y-axis in terms of the cumulative volume % of each phase in the system.
This is the same sort of "mode" that is determined by thin section point
counting.
-
CIPW Norm (liq) causes the components of the CIPW Norm of the liquid
to be plotted on the Y-axis.
Printing the Graphical Display
The Print button located at the bottom of the graphical display
window launches a dialog box that the gives the user the opportunity
to print the displayed graph. The dialog box entries and choices
displayed to the user will depend on the computer operating system in which
the APPLET is running. The output will depend on the printer driver
the user selects in the dialog. NOTE that accessing the
local printer requires that security restrictions normally imposed upon
APPLETS be relaxed. This involves explicit action by the user
in the form of configuring the web browser, appletviewer, or AppletRunner
prior
to running the APPLET. See the discussion of how to perform this
configuration on the APPLET
access web page.
Last modified: Fri, Jan 3, 2003


